One interruption every eleven minutes
It is a little past one in the morning and I am standing in the dark with a one-year-old on my shoulder. He has been asleep for about forty minutes, which is roughly how long it took to get him there, and now he is not, because a car has just gone full throttle out of the roundabout under our window with an exhaust that sounds like a shotgun with a stutter. Third time tonight. My knees hurt, my arms hurt, and somewhere down the street, a driver I have never seen, but could describe with some confidence, has proven something to himself.
We bought a flat downtown and knew there would be noise. That is part of the price and I was fine with it. What I had not priced in was this particular thing: a handful of people who have modified their cars to be as loud as possible and drive them past hundreds, probably thousands, of bedrooms, every evening, with nobody doing anything about it. The law forbids it in at least three places. But it seems nobody checks. It has quietly (!) become a normal feature of living in a modern city. These drivers are like artifical seagulls in mating seasion, but instead of being protected by law, they are breaking it.
I am a sleep-deprived parent with a grudge, so I am biased. I also work with computers for a living, so instead of simply complaining I built a thing to give my complaint some objective numbers.
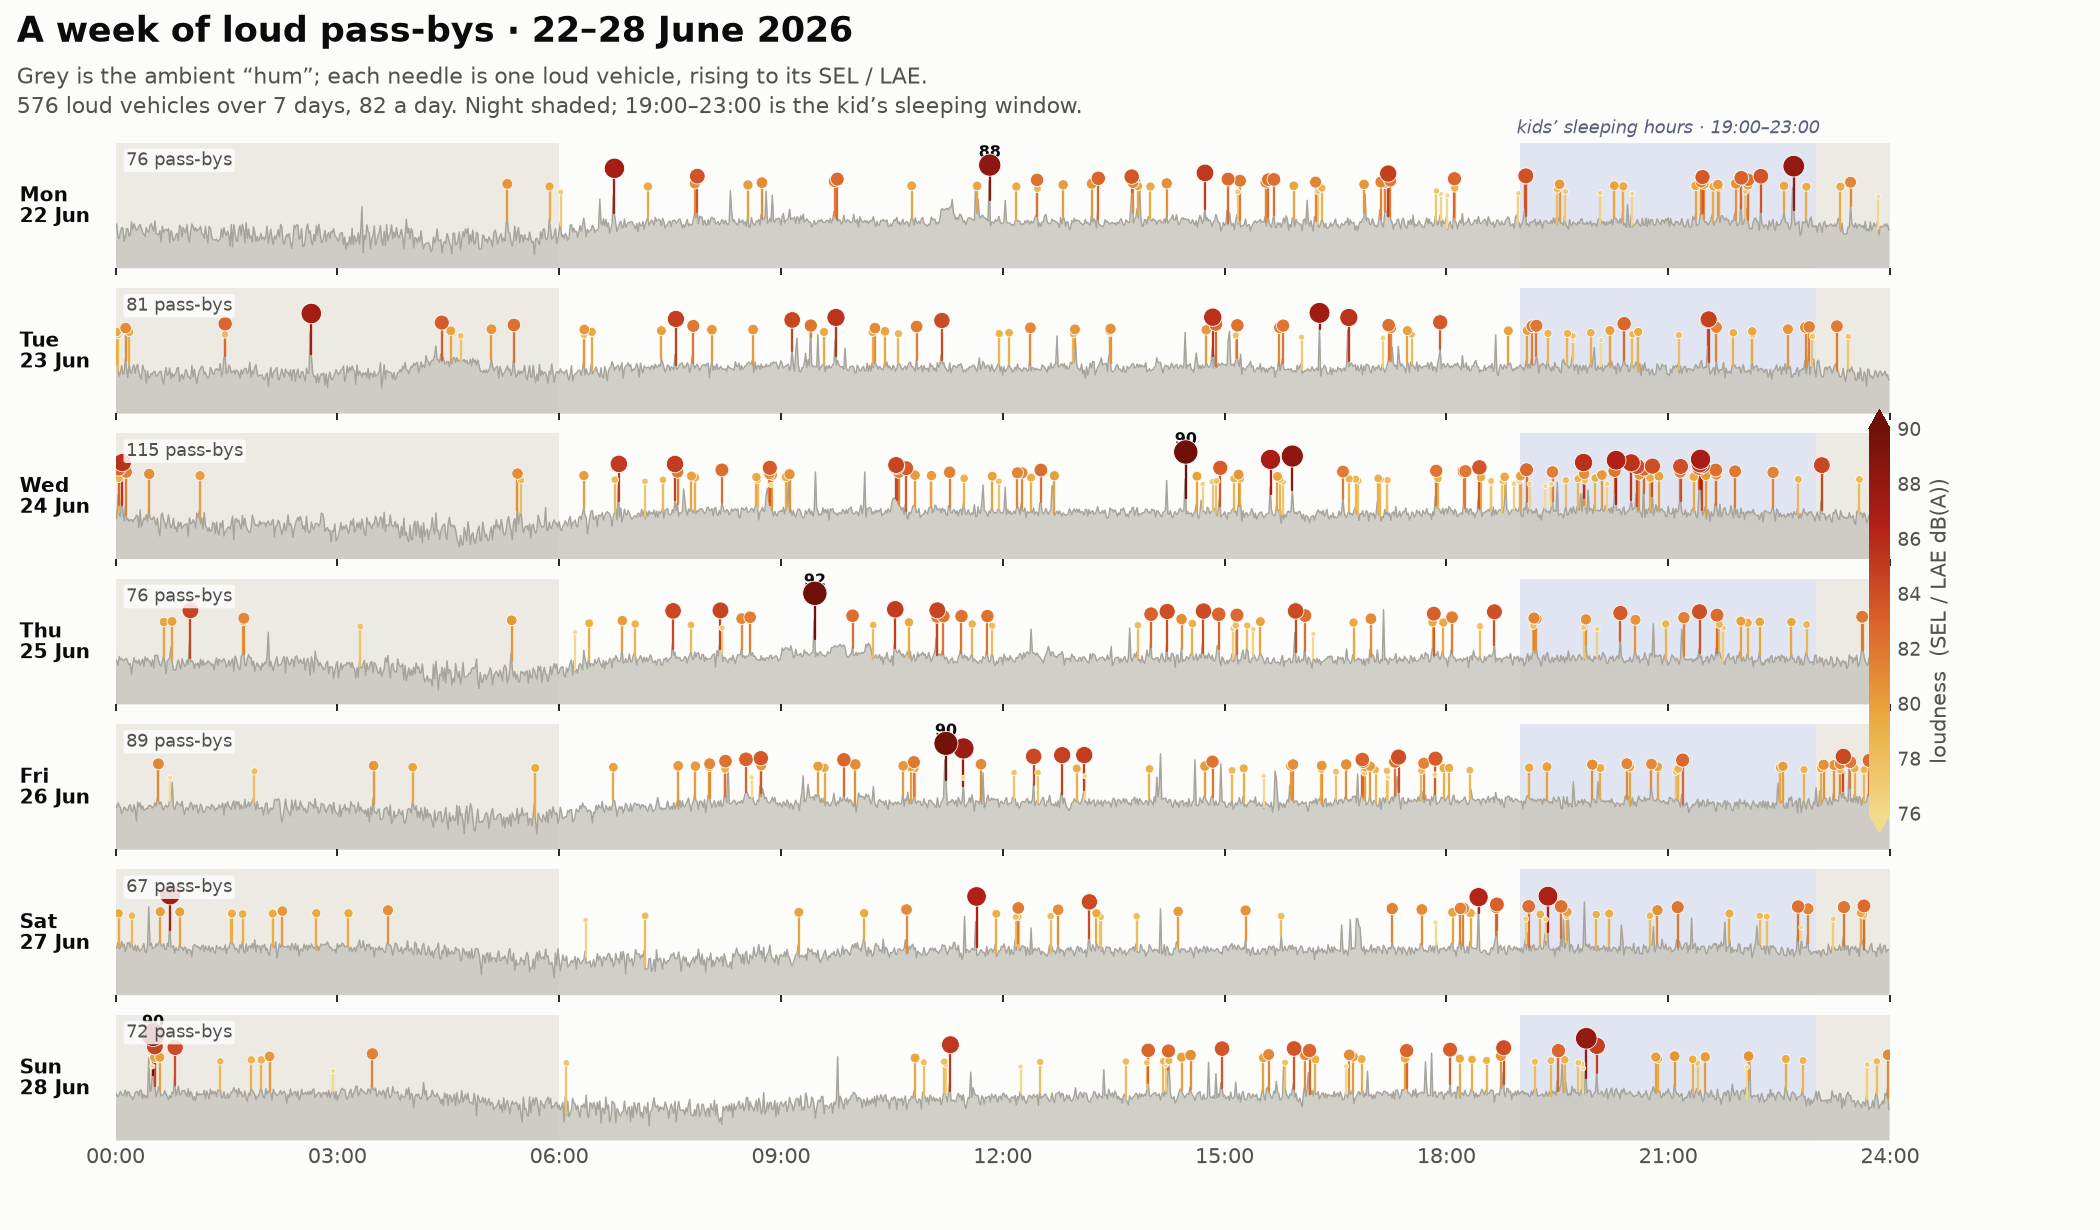
I put a microphone on my roof
I put a microphone I had lying around from the pandemic on the pitched roof of our building, about 20 metres from the nearest road, and calibrated it against my Google Pixel, which is said to be accurate to about 3 dB. I set it at the low end of that margin on purpose. Every level in here is dB(A), decibels weighted to what a human ear actually hears, and every one of them is probably a bit lower than the truth.
The data checks its own calibration, which is neat. A siren is the only sound on this street with a legally fixed loudness: an emergency vehicle must make 113–121 dB(A) measured 7 metres ahead of it.2 The loudest of my 793 sirens reads 107.2 dB(A) on the roof, which projected back to 7 metres is 116.3. Middle of the band. I may be off by two decibels. I am not off by ten.
The rig saves everything that stays above 72 dB(A) for two seconds. That is where “bothersome” starts, in my experience, and it is set high on purpose. Ordinary cars, buses and trucks do not trigger it. A quick hello-honk does not trigger it (I do that too, my threshold level is not nil). Sirens do, and so do a few trucks hauling something very heavy, which I count as fair. Everything else that trips it is genuinely loud, and the ones that clear the bar by a margin make little ripples in your glass of milk.
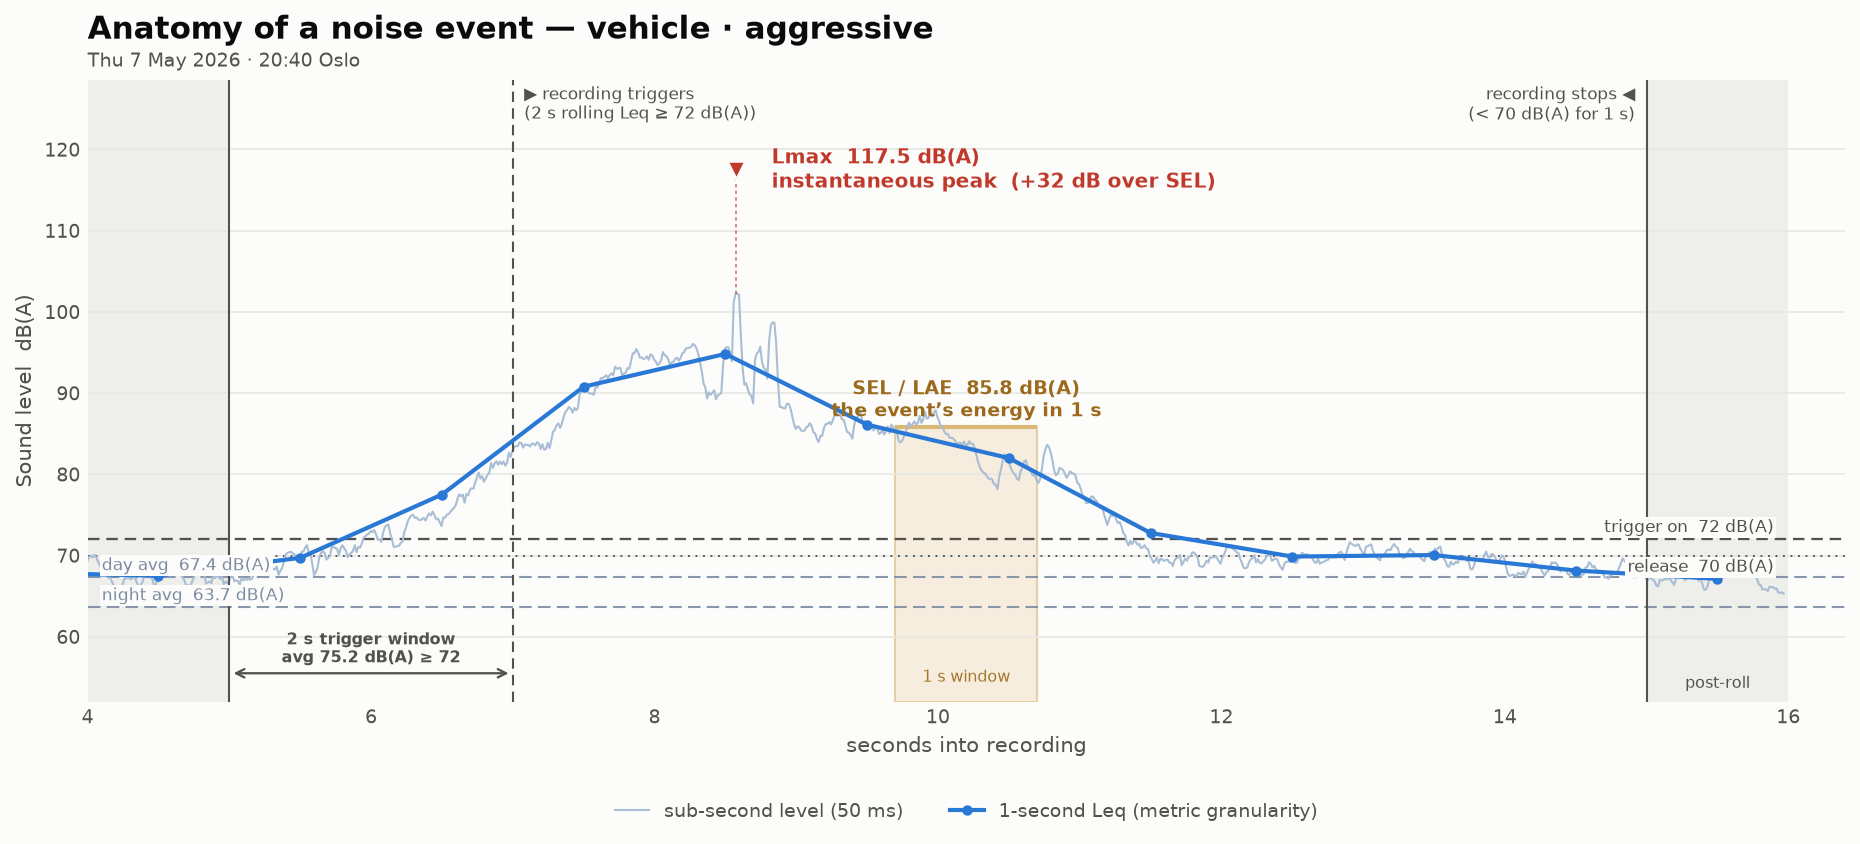
When I say how loud something was I mean LAFmax: the A-weighted maximum with the standard 125 millisecond “Fast” time constant, which is how nearly every noise limit in the world is written. It is a short running average, not the raw peak, and on a typical pass-by the peak reads 11.4 dB higher.
I recorded from April to mid July 2026 and use the full months of May and June: April had bugs, July has holidays. A bird pulled the mic cable on 22 May while I was out of town, which cost four days, so the window is 57 days. Besides the events, I logged the average level of every single second in the period, 99.5% of the wall clock.
What it heard
11,874 events in 57 days. 909 of them I listened to and labelled by hand; the rest were labelled by a machine-learning model trained on those labels (an audio transformer pre-trained on Google’s AudioSet, for the readers who care). Only one category matters for this piece, so that is the one I tested: I pulled 60 of the clips the model had called a loud vehicle, at random, listened without seeing its guess, and all 60 of them were loud vehicles. If it errs, it errs the other way, filing loud cars under helicopter. I therefore threat the vehicle count below as a floor.
4,509 of the events are loud vehicles, 79.1 a day. Statens vegvesen has a counting station on the far side of the roundabout, and through the same days it counted 815,493 vehicles through one arm of it.1 Cars come from the other directions too and are never counted. The real number is probably twice as high, but even against this conservative count, the loud ones are 0.55% of it. Both ends of that fraction flatter them, since the bottom is missing cars and the top counts the same car twice if it laps the block. The true share is probably a lot smaller.
Vegtrafikkloven § 3 says you must drive so that others are not unnecessarily disturbed, trafikkreglene § 16 forbids unnecessary noise in built-up areas, and kjøretøyforskriften § 24-1 says a vehicle “shall be built and equipped so that it does not develop unnecessary or bothersome noise”.3
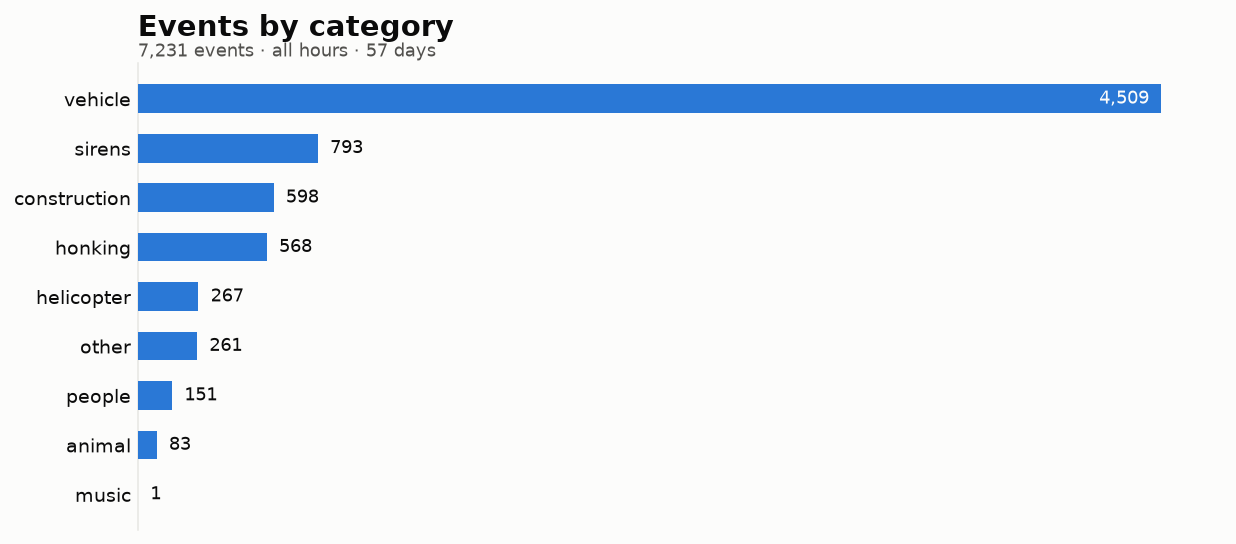
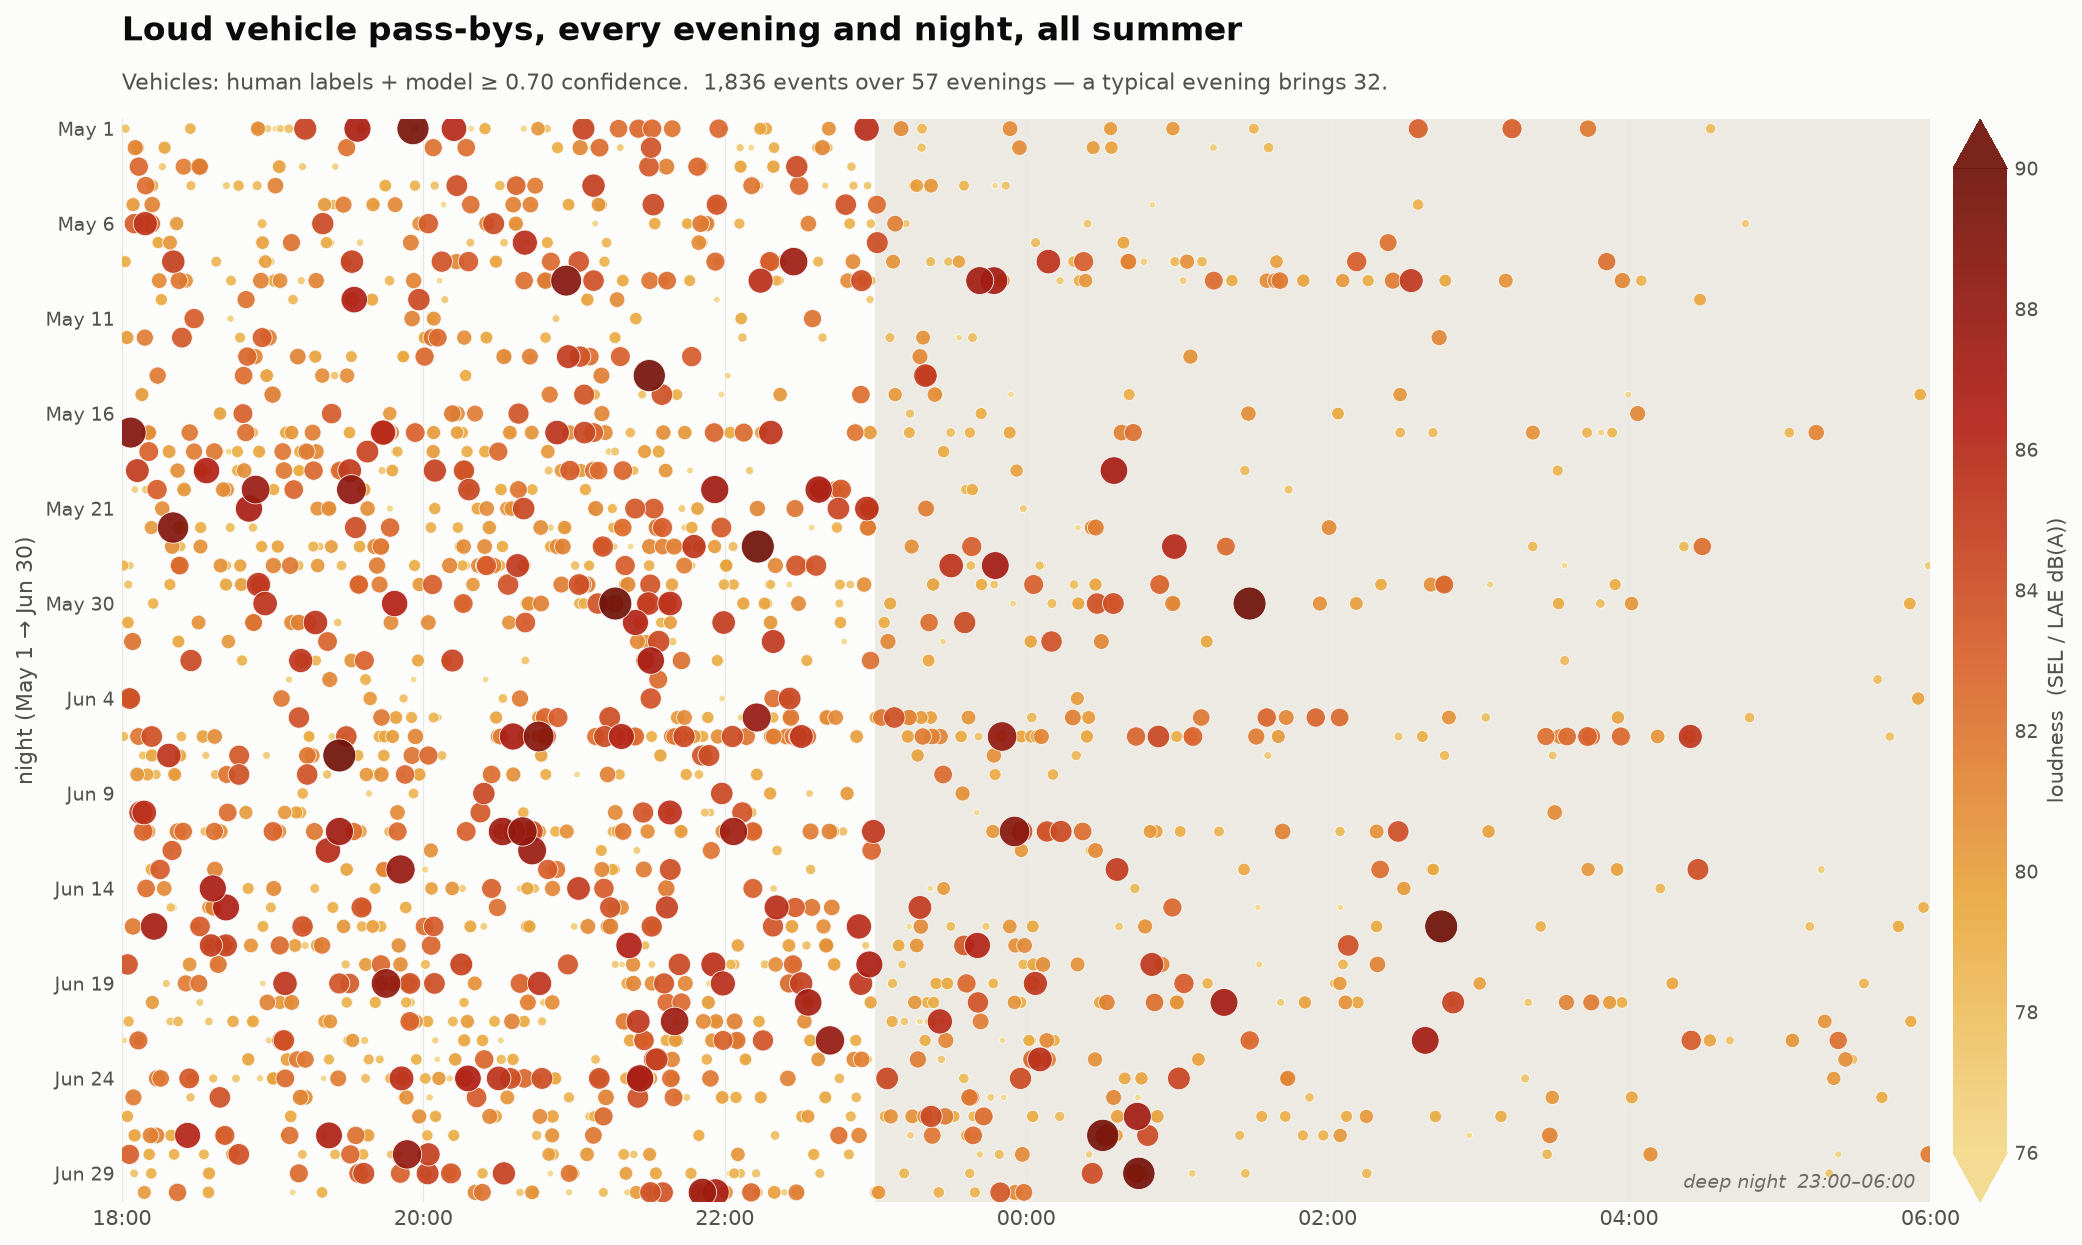
The night is the part I care about the most, so here are the same bars counted only inside my son’s sleeping hours, 19:00–07:00.
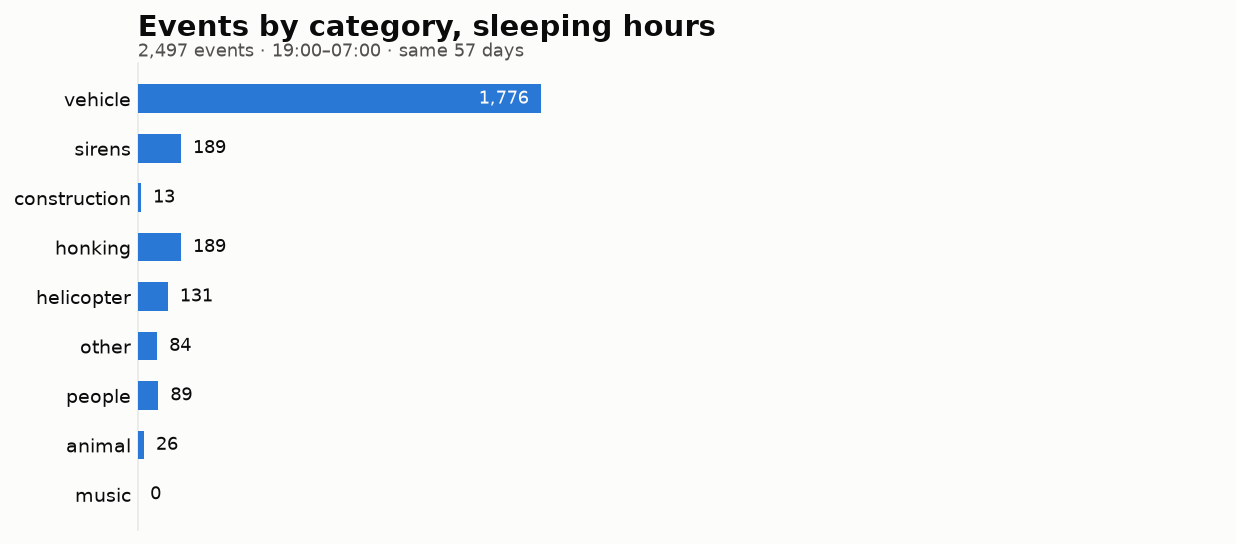
1,776 loud vehicles land in those hours, against 189 sirens. Most people, me included, would have guessed sirens are the night-time offender. Wrong, by a factor of nine. Sirens peak in the early afternoon and fall to a handful an hour between two and five in the morning, because ambulances tend to run on lights only at night.
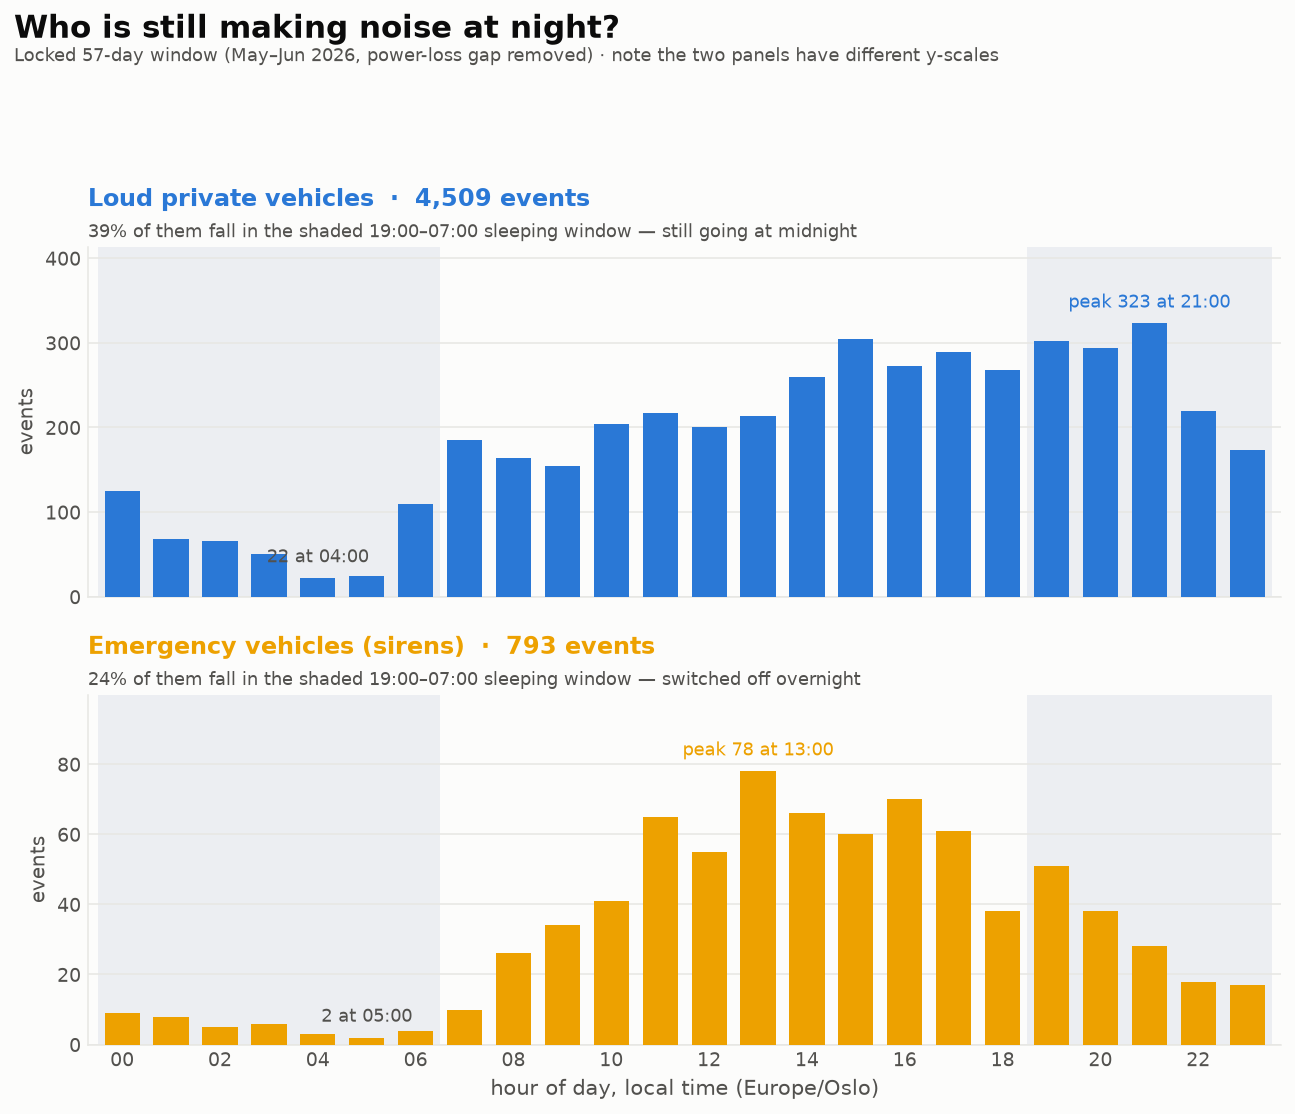
The worst three hours of the day are 19:00–22:00: 919 pass-bys over the period, 16.1 on an average evening, one every 11.2 minutes. The single worst hour is 21:00, and then it thins out through the night. This is not rush hour. These are the hours we eat, put the kid down and try to watch a film, and one every eleven minutes means the film gets rewound ten seconds a lot. You do not get used to it the way you get used to a motorway drone, because the whole point of the sound is that it arrives from nowhere and peaks in about a second. It is a bit like having strangers send you dick pics through the night. I did not ask for this, and the sender has decided that does not matter.
How loud are they? I report on two numbers per event. LAFmax is how loud it got at its worst. SEL (sound exposure level) folds loudness and duration into one figure by compressing all the sound energy into one second: so a loud car droning past for twenty seconds can outrank a motorcycle cracking past in three. SEL is what the aviation world has measured in for decades, which matters later.
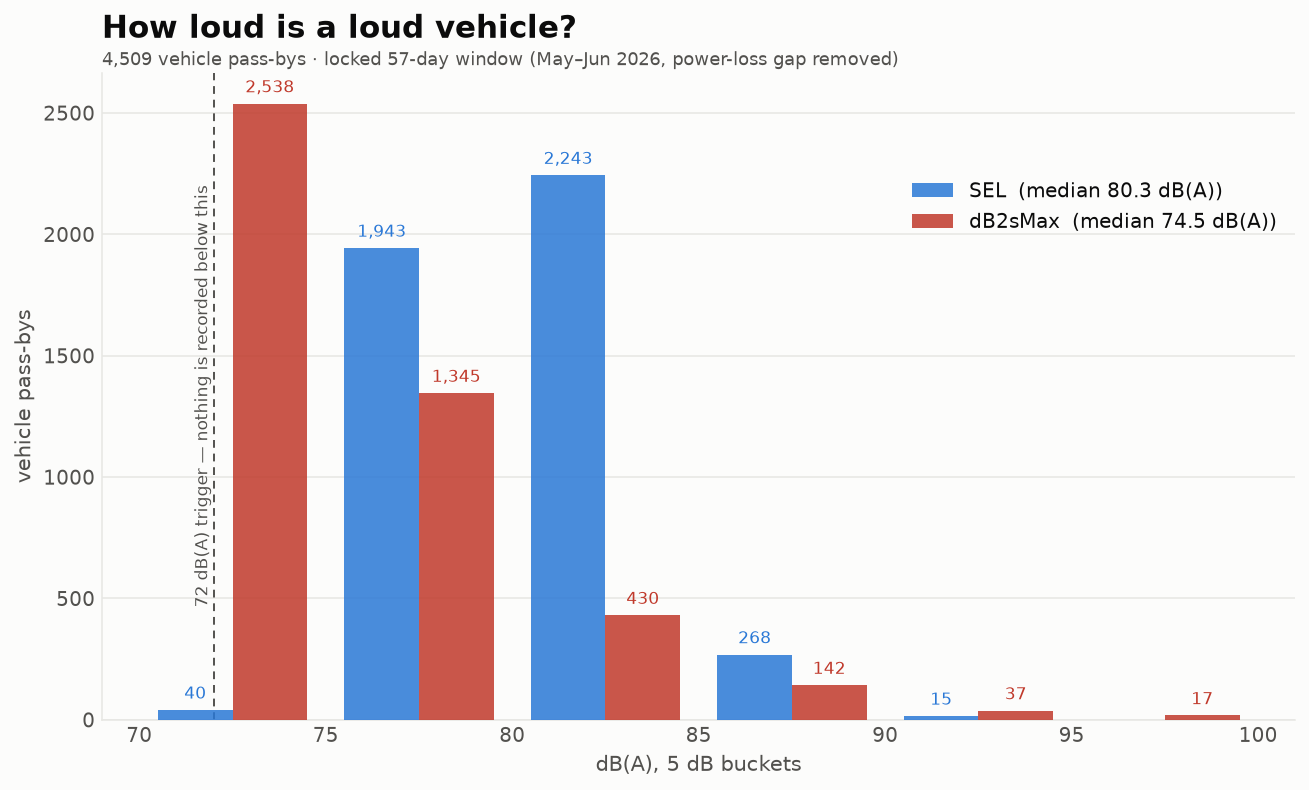
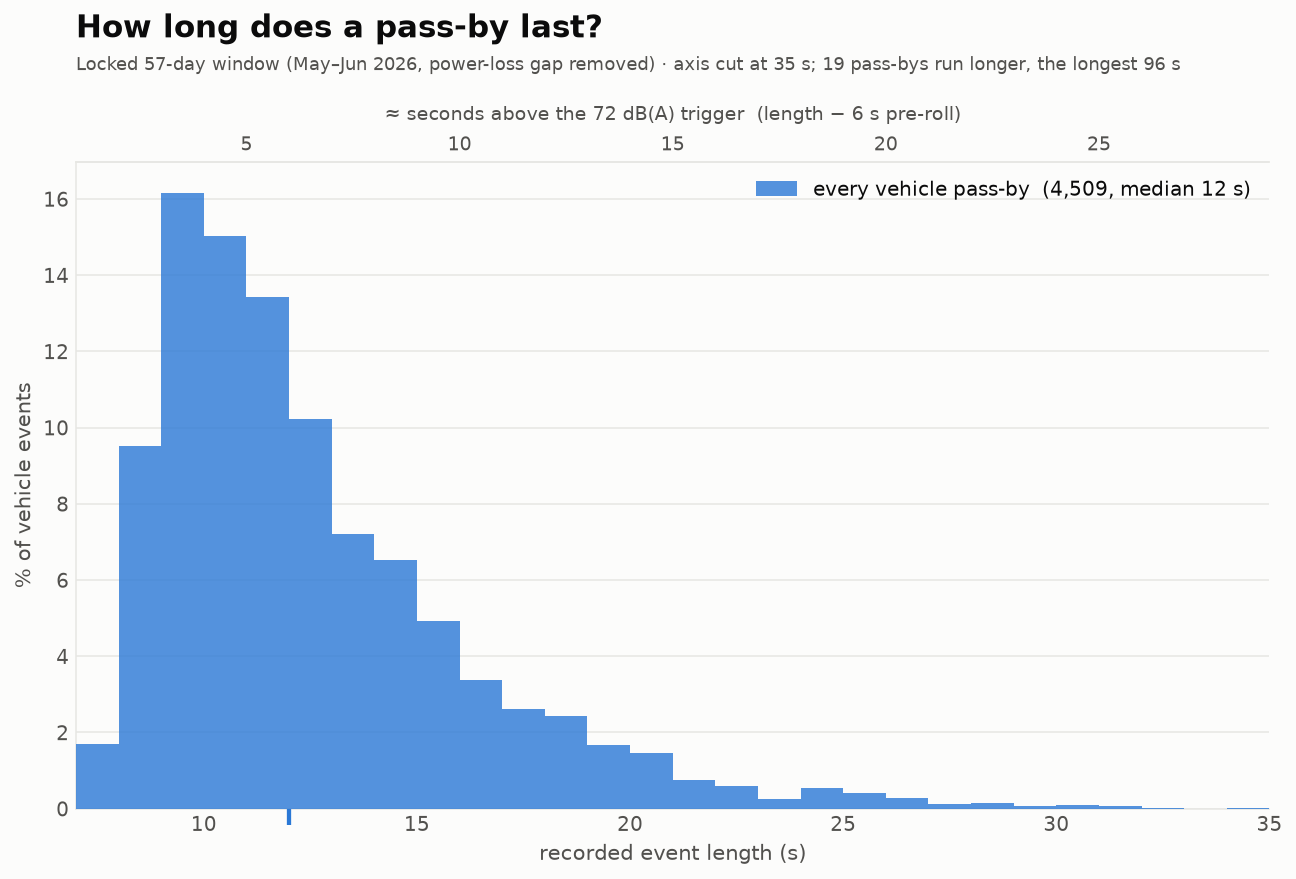
The median pass-by reads 77.2 dB(A) LAFmax up on the roof. 1,308 of them (29%) reach 80, 470 reach 85 and 157 reach 90. Rather than quote the single loudest car, which always feels like an anecdote, I will lean on the 90th percentile: one vehicle in ten reaches 85.2 dB(A) or more. That is 451 vehicles in 57 days. The median event lasts 12 seconds and 5% of them run past twenty.
What a vehicle is allowed to make
Type approval limits a car to 74.0 dB(A) and a big motorcycle to 82.0 dB(A), measured in a standard drive-by at 7.5 metres.4 My microphone is 20 metres off, which on plain geometry is 8.5 dB quieter, so a car at its legal limit should reach me at 65.5 dB(A). That is the real reason ordinary traffic never trips a 72 dB trigger. Run the same sum backwards on the one-in-ten vehicle (that being the 90 percentile) and you get 93.7 dB(A) at the test distance, 19.7 dB over the limit. Decibels are logarithmic, so that is about 94 times the acoustic energy the law allows, and roughly 4 times as loud to a human ear (a step of 10 dB feels about twice as loud).
People with much better gear than mine have found the same gap between the test and the street. The TRUE Initiative measured real-world vehicle noise in Brussels in 2020 and again in 2023, and the NEMO project did the same in Barcelona: street noise has not fallen even as new vehicles meet ever tighter type-approval limits.5 They compare it to Dieselgate, which is fair.
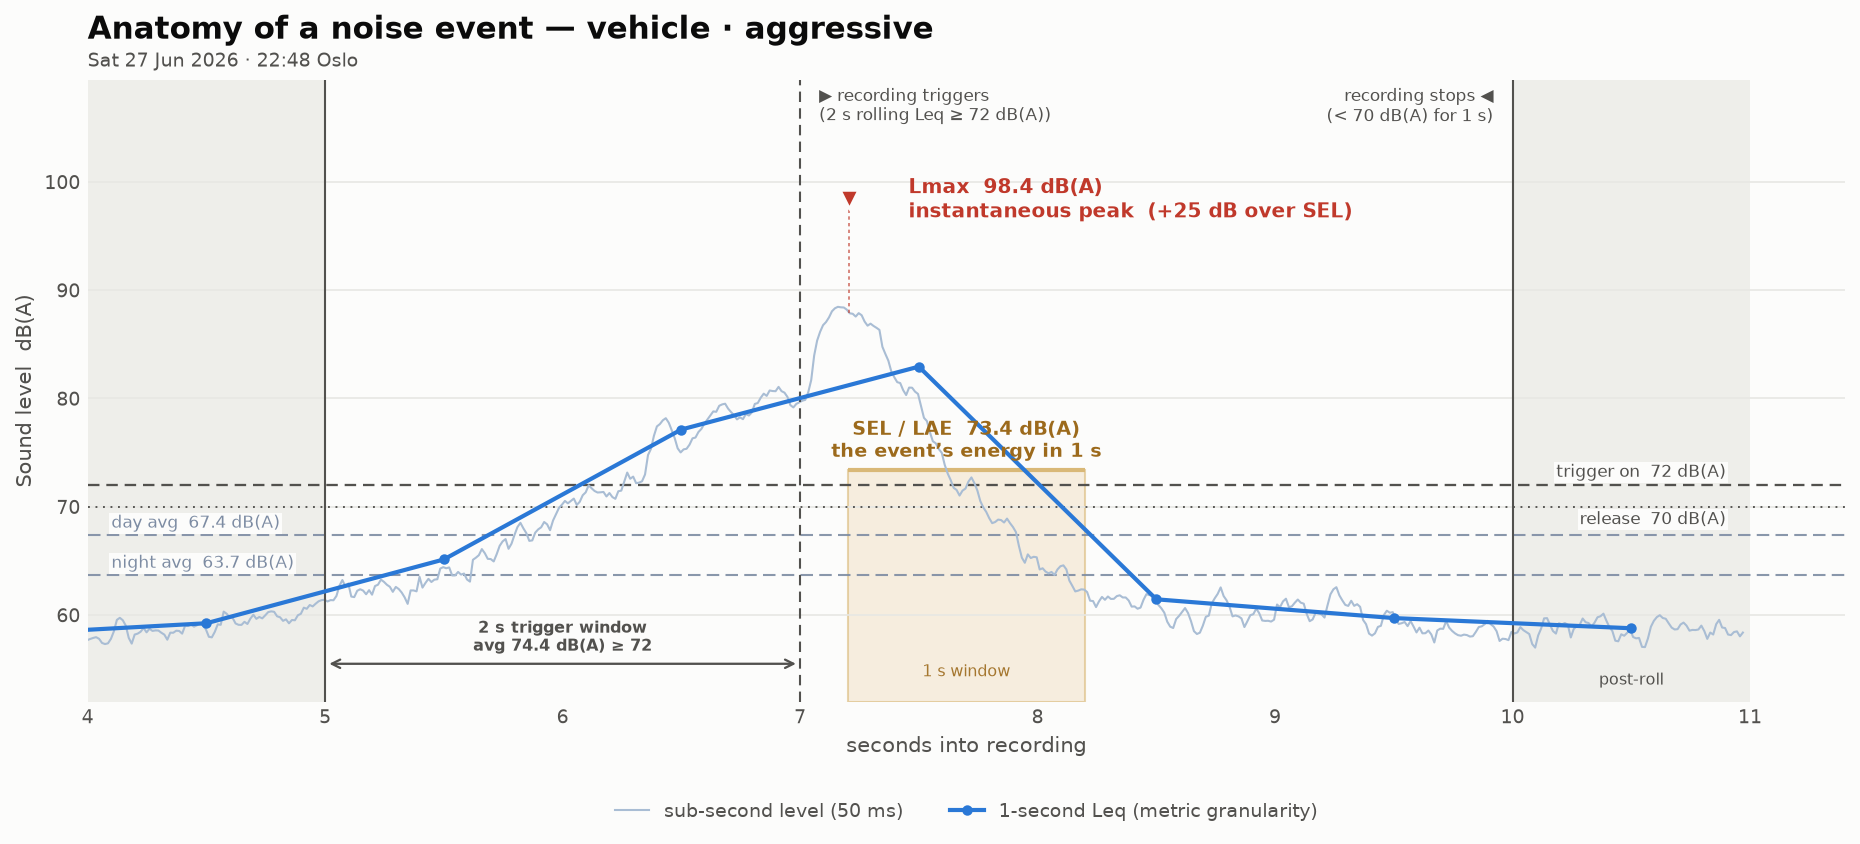
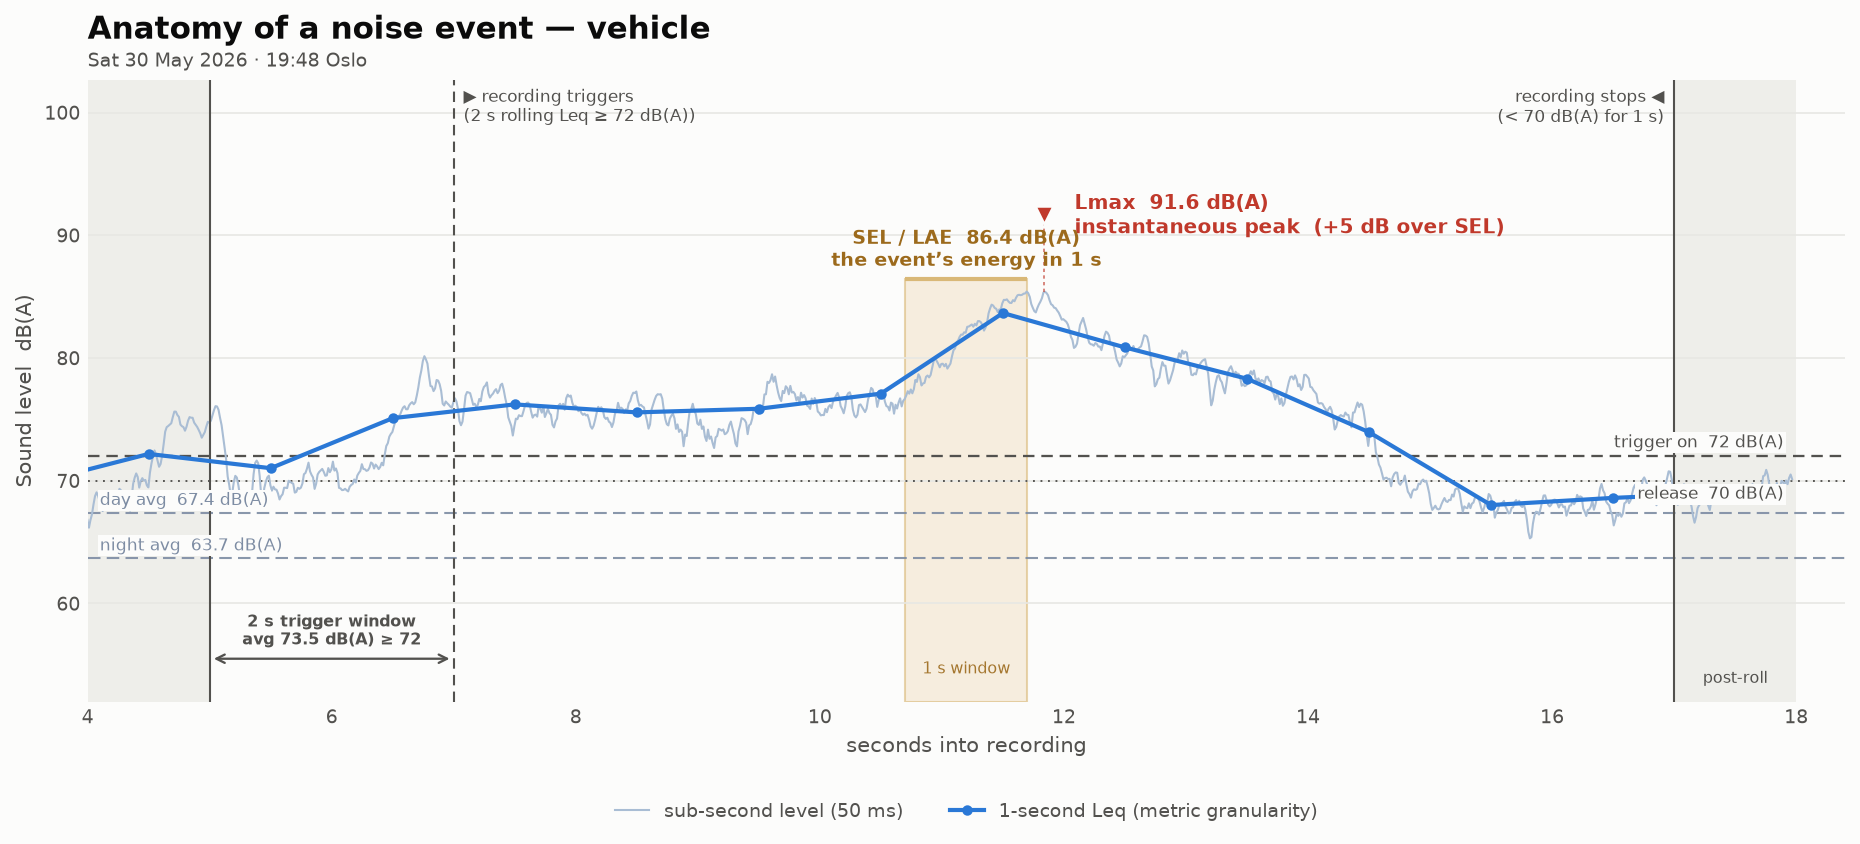
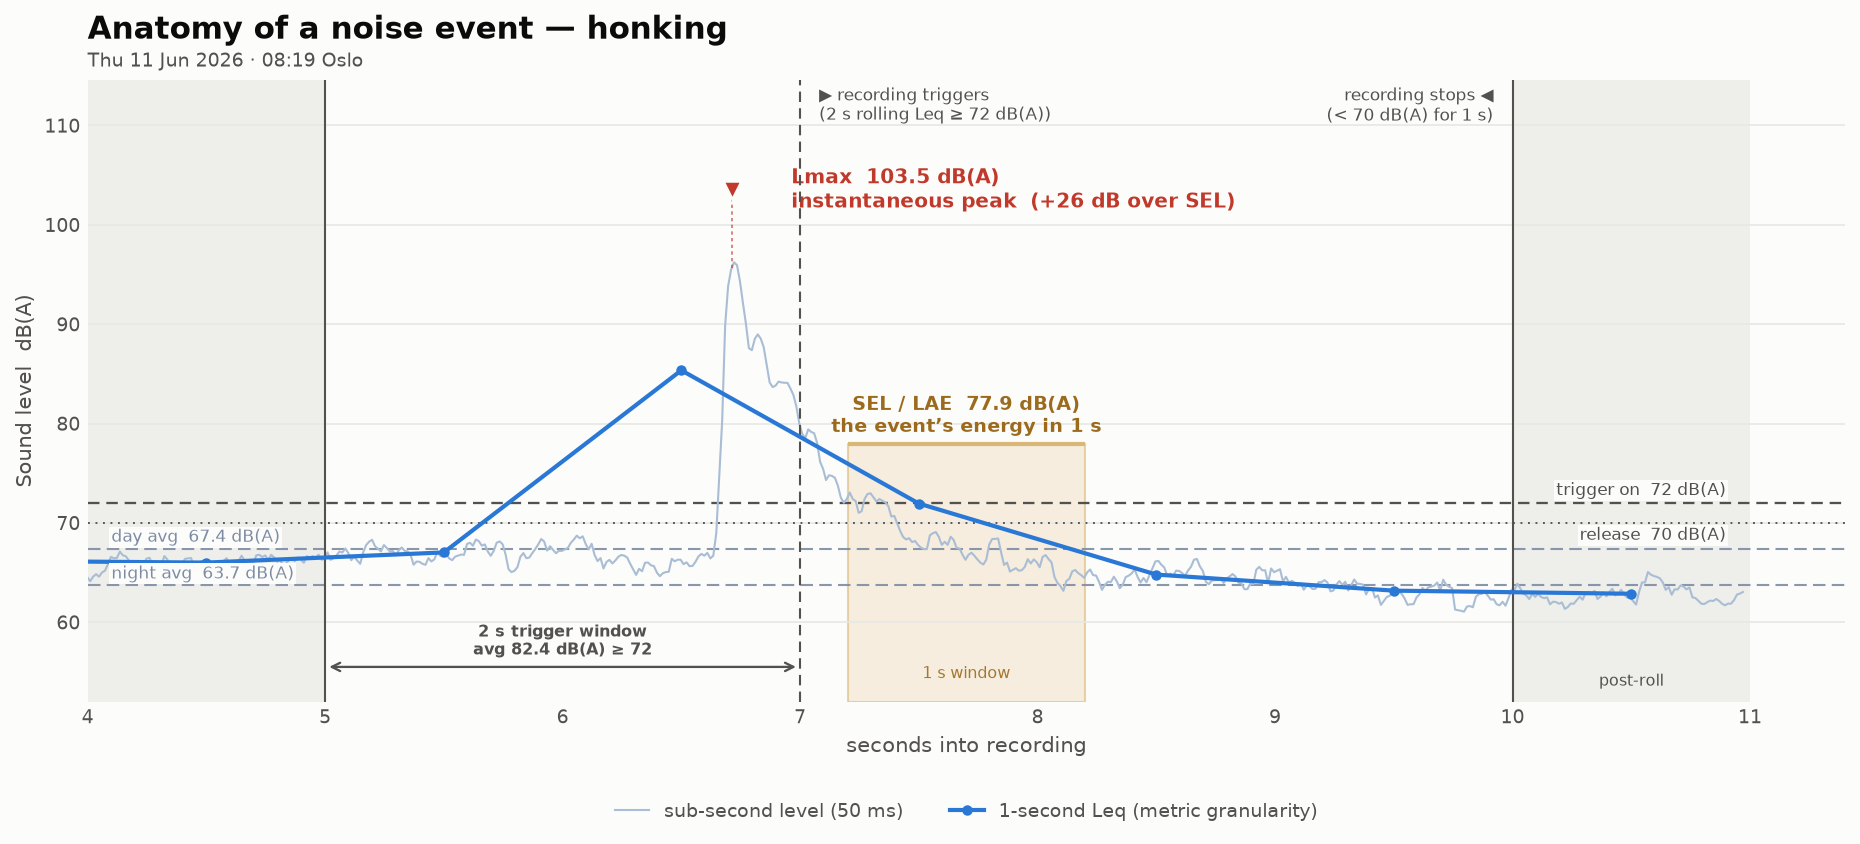
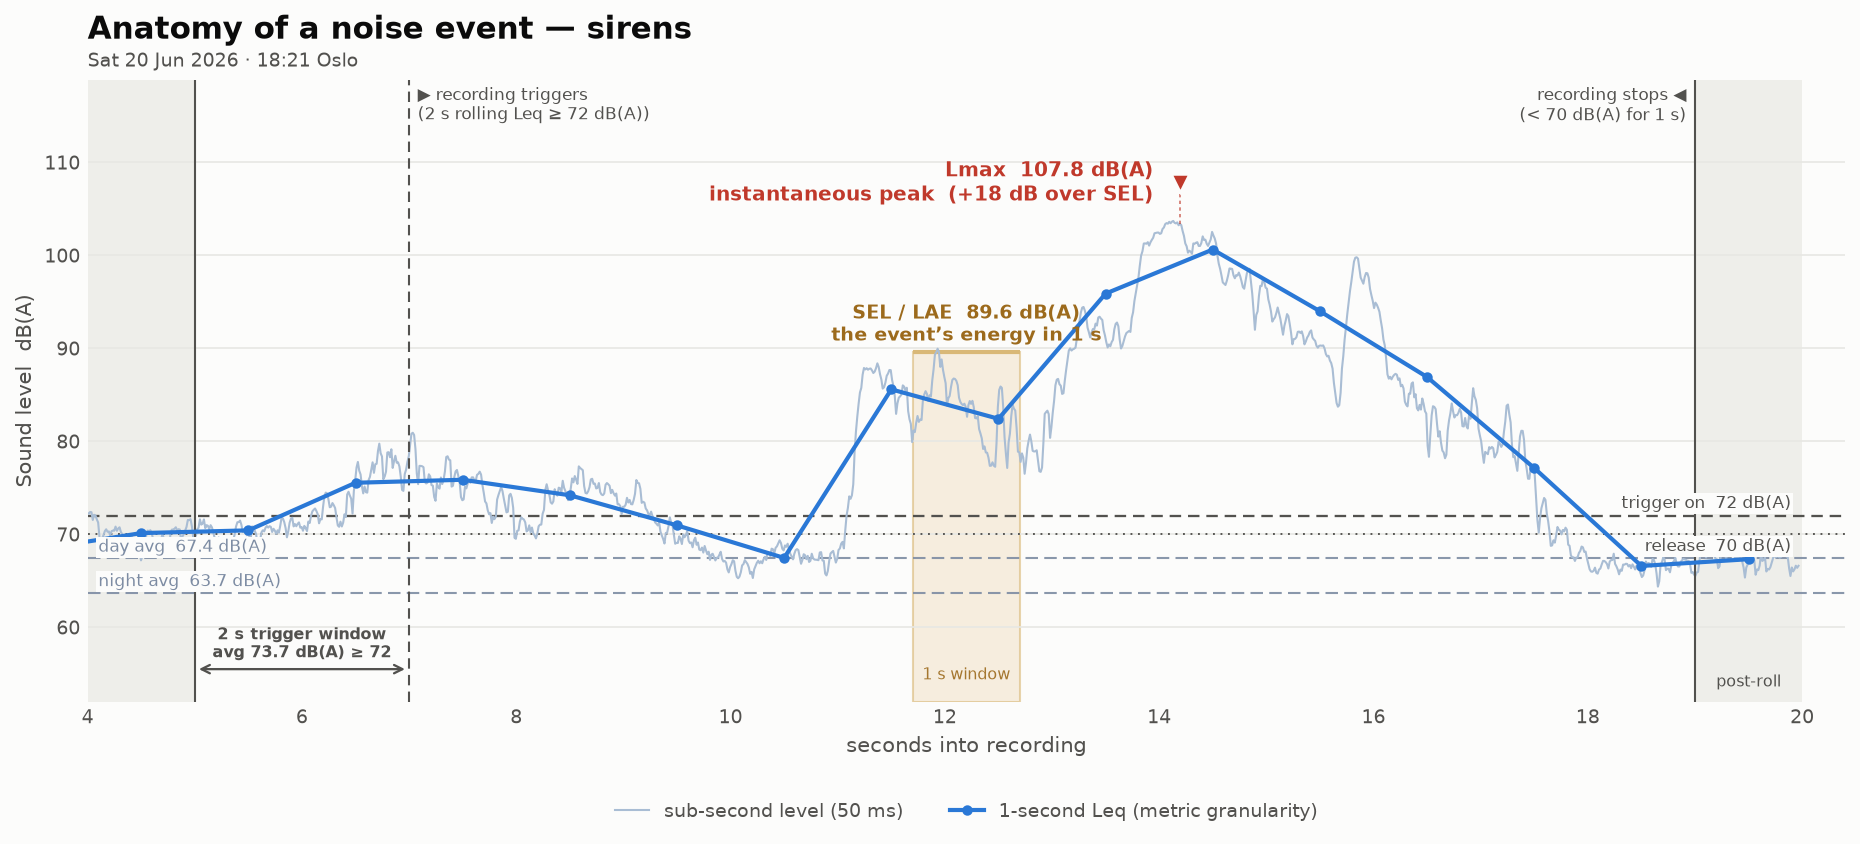
Some samples. I would describe the average event as a car or motorcycle with a modified exhaust going full throttle out of the roundabout in one of four directions. If it comes our way it is loud; if it goes another way it is somebody else’s evening. The spectrograms mark the trigger points and the usual background level.
Sleep
My son’s crib is a few metres closer to the road than the microphone. Our twenty-year-old windows take off about 25 dB, so the median night-time pass-by lands at 49.8 dB(A) at the pillow and one in ten at 56.8 or above. The WHO wants a bedroom under 30 dB(A) at night.
My kid’s wake-ups are an anecdote, but there is some literature out there. The review behind the WHO’s 2018 noise guidelines re-analysed two big German studies of people sleeping in their own beds wired to an EEG, and fitted the odds of being knocked out of sleep against the indoor maximum of a single passing vehicle.6 Put my numbers through it and the median night-time pass-by carries a 3.5% chance of waking a sleeper, the one-in-ten a 5.9% chance. Small odds. But there are 31.2 of them a night, and summed over every event in the sleeping window the curve predicts 1.24 extra awakenings per night, 70.4 over the period. When Basner and colleagues wrote down what protecting sleep from aircraft noise should mean, their first goal was fewer than one extra awakening a night.7 Whole airports are regulated around staying under that line. My street, from private vehicles alone, sits over it.
I will be fair about the range. That curve counts EEG sleep-stage changes, some of which nobody remembers in the morning. A newer field study with microphones at forty sleepers’ ears and 11,003 pass-bys counted only full awakenings and found far fewer, 2.0% at 70 dB(A) at the ear.8 The paper is paywalled, so I rebuilt its curve from the two endpoints in the abstract, reading them the way that puts my events highest, and it gives at most 0.13 extra awakenings a night. So the honest answer is somewhere between 0.13 and 1.24 a night, depending on whose study you prefer. Both are fitted to adults. The only child study I found followed 2,665 Oslo kids from the Mother and Child Cohort and saw a modest link between night-time road noise and short sleep in seven-year-old girls, with exposure measured, of course, as an average.9 At the low end our kid gets one extra wake-up a week. At the high end, more than one a night. My money is on the high end, and I have stood in the dark holding the evidence.
All of this assumes shut windows. Through summer we cannot open them at all, which is the season you most want to, and the municipality does not allow air conditioning on the facade either.
Why nobody sees it
A side note, but an interesting one. The number municipalities regulate by is Lden, an energy average over a whole year with penalties on evening and night. Since I have a level for every second and know which seconds belong to which event, I can ask what Lden would say if the loud vehicles vanished: replace every second inside a vehicle event with that hour’s normal background and recalculate. The 4,509 events cover 65,694 seconds, 1.34% of the period, and deleting them moves Lden from 70.54 to 70.26 dB. A change of 0.27 dB. The UK highway standard, which has to put a number on this because it decides who gets compensated, calls anything under 1.0 dB “negligible”, the bracket below “minor”.10 So my municipality’s number is correct and useless here. What is wrong on this street is rare, brief and violent, which is exactly the shape an average is built to smooth away. Noise walls and quiet asphalt lower averages.
What other places do
France went furthest and is the best warning. A 2019 law authorised automatic noise radars, a 2022 decree created the offence, and a 2023 order set the threshold at 85.0 dB(A) in built-up areas. Seven towns joined, Paris, Nice and Toulouse among them, with a €135 fine.11 Four years on, not one French driver has been fined by one. The devices are still not approved, because proving in court that this car made that noise, and not the one passing the other way, turns out to be hard.12 Bruitparif’s sensor does it with four microphones in a tetrahedron that triangulate the sound onto a wide-angle photo, and it is one of two systems now in certification.13 New York did not wait: twelve noise cameras under Local Law 7 of 2024 caught 15,994 events in 2025, issued 1,691 summonses, had 1.2% of them dismissed, and the minimum fine is $800.14 The UK has done two rounds of government research and funded four trial sites, and the borough of Kensington and Chelsea has quietly been fining people £100 since 2020 using the same camera supplier New York buys from.15 But as of mid-2026 no acoustic radar is type-approved anywhere in Europe, so a machine-issued fine would not survive an appeal.
Which is why the example I like is Brussels, and it is low-tech. Belgium has no legal basis for automatic meters, so Brussels Mobility does roadside checks with police and a handheld sound meter. In three operations in spring 2024, 17% of the motorcycles checked failed; across eight operations in 2025 it was 35%. Fail and you are sent to a full technical inspection at your own expense.16 A speed gun, but for noise.
Then there are the people who have been loud-vehicled at for fifty years and have a whole regulatory machine to show for it: the ones under a flight path. Aviation counts single events in SEL, the same unit as my histogram. Departure contours are drawn at SEL 80 and 90, arrivals at 70 and 80. One vehicle in ten past my window reads 84.1 dB(A) SEL, above the lower departure contour and above both arrival ones. Australia hit exactly my problem in 2000, when Sydney residents refused to believe an averaged metric for the third runway, and answered with “N-above” contours: N70, N60, the number of events a day above a level.17 The environmental statement for Western Sydney’s new airport uses N60 at night, where an outdoor event gives 50 dB(A) indoors with the window open, “close to the point at which someone sleeping may wake up”, and the lowest contour they bothered to draw was 2 events a night.18 Two. My street runs 31.2. At Heathrow every landing pays a noise charge by category, £706 for the quietest band and £14,114 for the noisiest in 2025, night movements pay two and a half times that, and the night period is capped by a noise quota on top.19 It works, too: Heathrow’s 55 dB Lden contour shrank 41% between 2006 and 2023. A plane at SEL 80 consumes quota, pays a fee and appears on a published map. A car at SEL 84.1 at one in the morning, past hundreds of bedrooms, consumes nothing, pays nothing, and is measured by nobody.
What to do about it
Two asks, both cheap next to a noise wall. First, do to noise what you already do to speed. Police stand at the roadside with a laser gun and the whole country knows it; stand there with a sound meter as well, the Brussels way, and send the failures to inspection at their own cost. The law is already written, it just needs someone holding the instrument. Second, there are already counting stations at roundabouts like mine, many of them, ticking off every axle that passes. Register signatures from loud vehicles and publish N75: how many vehicles a day went past above 75 dB(A). Australia invented the metric for airports and it fits roads as well. Once such number exists, the loud ones stop hiding inside an average and become a count somebody has to answer for.
Limitations
- My setup is sensitive to rain, so every rain event (2,416 of them) is removed and the 45,565 seconds they cover are replaced with the same hour’s average with the rain taken out. Rain is weather, not an event, and it is in none of the numbers above.
- The bird. four calendar days, 22–25 May, are dropped from every figure, which is why the period is 57 days and not 61.
- The calibration is good to about 3 dB and deliberately set low. The siren check says the error points the way I claim, not that it is zero.
- Both awakening curves are fitted to adults. Nobody has fitted one for a one-year-old.
- The 8.5 dB distance correction is free-field geometry, no ground effect, no screening. It puts two numbers on one axis; it is not a measurement.
Why don’t I just move? I will (hehe). But this is not about me. It is about the hundreds of households around one roundabout, and the thousands around all the others, and a country that has decided not to look. Meanwhile it is 01:00, the kid is finally heavy on my shoulder, and I can hear the next one winding up on the far side of the roundabout.
-
Statens vegvesen trafikkdata, station 62991V604777, week volumes May–June 2026. One arm of the roundabout only. ↩
-
Kjøretøyforskriften(FOR-1994-10-04-918) § 29-1 nr. 8: a “wail” siren must produce 113–121 dB(A) at 7 m, free field, on the vehicle’s centreline. The back-projection uses the same 20·log₁₀ conversion as the type-approval sum, and the two corrections I ignore (a passing siren is broadside, and my roof is further off in a straight line) both push the result up. ↩ -
Vegtrafikkloven§ 3;trafikkreglene(FOR-1986-03-21-747) § 16;kjøretøyforskriften§ 24-1 nr. 1, my translation. ↩ -
Kjøretøyforskriften§ 24-5 nr. 3 and § 24-8 nr. 3. Distance correction 20·log₁₀(20/7.5) = 8.5 dB. ↩ -
The Real Urban Emissions (TRUE) Initiative, “Traffic noise pollution is the latest threat to cities worldwide”, 25 February 2026; NEMO (Noise and Emissions Monitoring and Radical Mitigation), EU Horizon 2020, 2020–2023. ↩
-
Basner, M. & McGuire, S. (2018), “WHO Environmental Noise Guidelines for the European Region: A Systematic Review on Environmental Noise and Effects on Sleep”, IJERPH 15(3): 519. Their equation (1), fitted to the STRAIN and DEUFRAKO field studies (94 sleepers); it takes the indoor LAS,max and crosses zero at about 37 dB(A), below which I clamp it. ↩
-
Basner, M., Samel, A. & Isermann, U. (2006), “Aircraft noise effects on sleep”, JASA 119(5): 2772–2784. The first of three objectives, against a baseline of roughly 24 spontaneous awakenings a night. ↩
-
Sanok, S. et al. (2022), “Road traffic noise impacts sleep continuity in suburban residents”, Science of the Total Environment 817: 152594. The abstract gives 0% at 27.1 dB(A) and 2.0% at 70; a logistic through those two points, with “0%” read as 0.05%, is the shallowest slope they allow and so the highest probability for every event below 70 dB(A). 99.7% of my night-time pass-bys fall inside the range they measured. ↩
-
Weyde, K.V., Krog, N.H., Oftedal, B. et al. (2017), “Nocturnal Road Traffic Noise Exposure and Children’s Sleep Duration and Sleep Problems”, IJERPH 14(5): 491. Per 10 dB of night-time road noise the odds of a seven-year-old girl sleeping ten hours or less rose 21%; no significant association in the sample as a whole. ↩
-
LA 111 Noise and vibration, Revision 2, National Highways (UK), 2020, Table 3.17: “Negligible: less than 1.0” dB, “Minor” 1.0 to 3.0. Norway publishes no equivalent band, and acoustics do not change at the border. ↩
-
Loi d’orientation des mobilités (2019) art. 92; décret n° 2022-1 du 3 janvier 2022; arrêté du 7 juillet 2023. Sites: Paris, Nice, Toulouse, Bron, Rueil-Malmaison, Villeneuve-le-Roi, Haute Vallée de Chevreuse. ↩
-
Cerema, “Radars sonores : le Cerema contribue aux expérimentations et à l’homologation des dispositifs avant déploiement”. Certification testing began at Montlhéry in December 2025. ↩
-
Bruitparif, “Le capteur Méduse”. Its Hydre radar is one of the two systems in certification. ↩
-
NYC Department of Environmental Protection, 2025 Annual Report for Noise Camera Enforcement Program, Local Law 7 of 2024. Penalties imposed $1,472,265, collected $308,229; programme cost $601,657. ↩
-
UK Department for Transport acoustic camera studies, phase 1 (2019) and phase 2 (2021); trial sites in Bradford, South Gloucestershire, Great Yarmouth and Birmingham on £300,000. RBKC details from Institute of Acoustics, Briefing Note: Noise Cameras on our Roads, November 2022. ↩
-
Bruxelles Environnement, “Bruit routier : mesures et actions”, citing Bruxelles Mobilité control campaigns of 2024 and 2025. Brussels Environment also ran the Hydre and dBFlash radars in 2023, as research. ↩
-
Department of Transport and Regional Services (Australia), Expanding Ways to Describe and Assess Aircraft Noise, March 2000. ↩
-
Western Sydney International Airport, Environmental Impact Statement, Chapter 11: Aircraft noise, November 2024. ↩
-
Heathrow Airport Limited, Airport Charges for 2026 consultation, Table 13; UK Department for Transport, Night Flight Restrictions at Heathrow, Gatwick and Stansted from October 2025. Winter night quota: 2,550 movements and 2,415 quota points. ↩